Collecting Application Metrics on Amazon EKS Fargate
Modern cloud-native applications demand observability strategies that can adapt to dynamic, distributed environments while maintaining security, scalability and flexibility. As organizations adopt cloud-native architectures, the ability to observe and respond to application behavior has become a critical requirement for ensuring reliability and security.
Traditional host-based monitoring approaches no longer apply in a world where workloads are ephemeral, autoscaled and abstracted away from the underlying infrastructure. At Several Clouds, we help organizations bridge this gap by leveraging open-source standards alongside AWS-managed services.
A Flexible Approach to Metric Collection
The foundation of modern observability is the ability to collect, process and analyze application metrics that accurately describe the behavior and health of workloads. While infrastructure-level monitoring covers CPU and memory, application-level metrics provide insight about the application’s behavior during runtime - request latencies, throughput, error rates, or custom business-specific measurements.
For workloads running on Amazon EKS Fargate, the strategy must adapt to operate without direct host access. This is where the AWS Distro for OpenTelemetry (ADOT) and Amazon Managed Service for Prometheus (AMP) come into play.
Architecture Overview
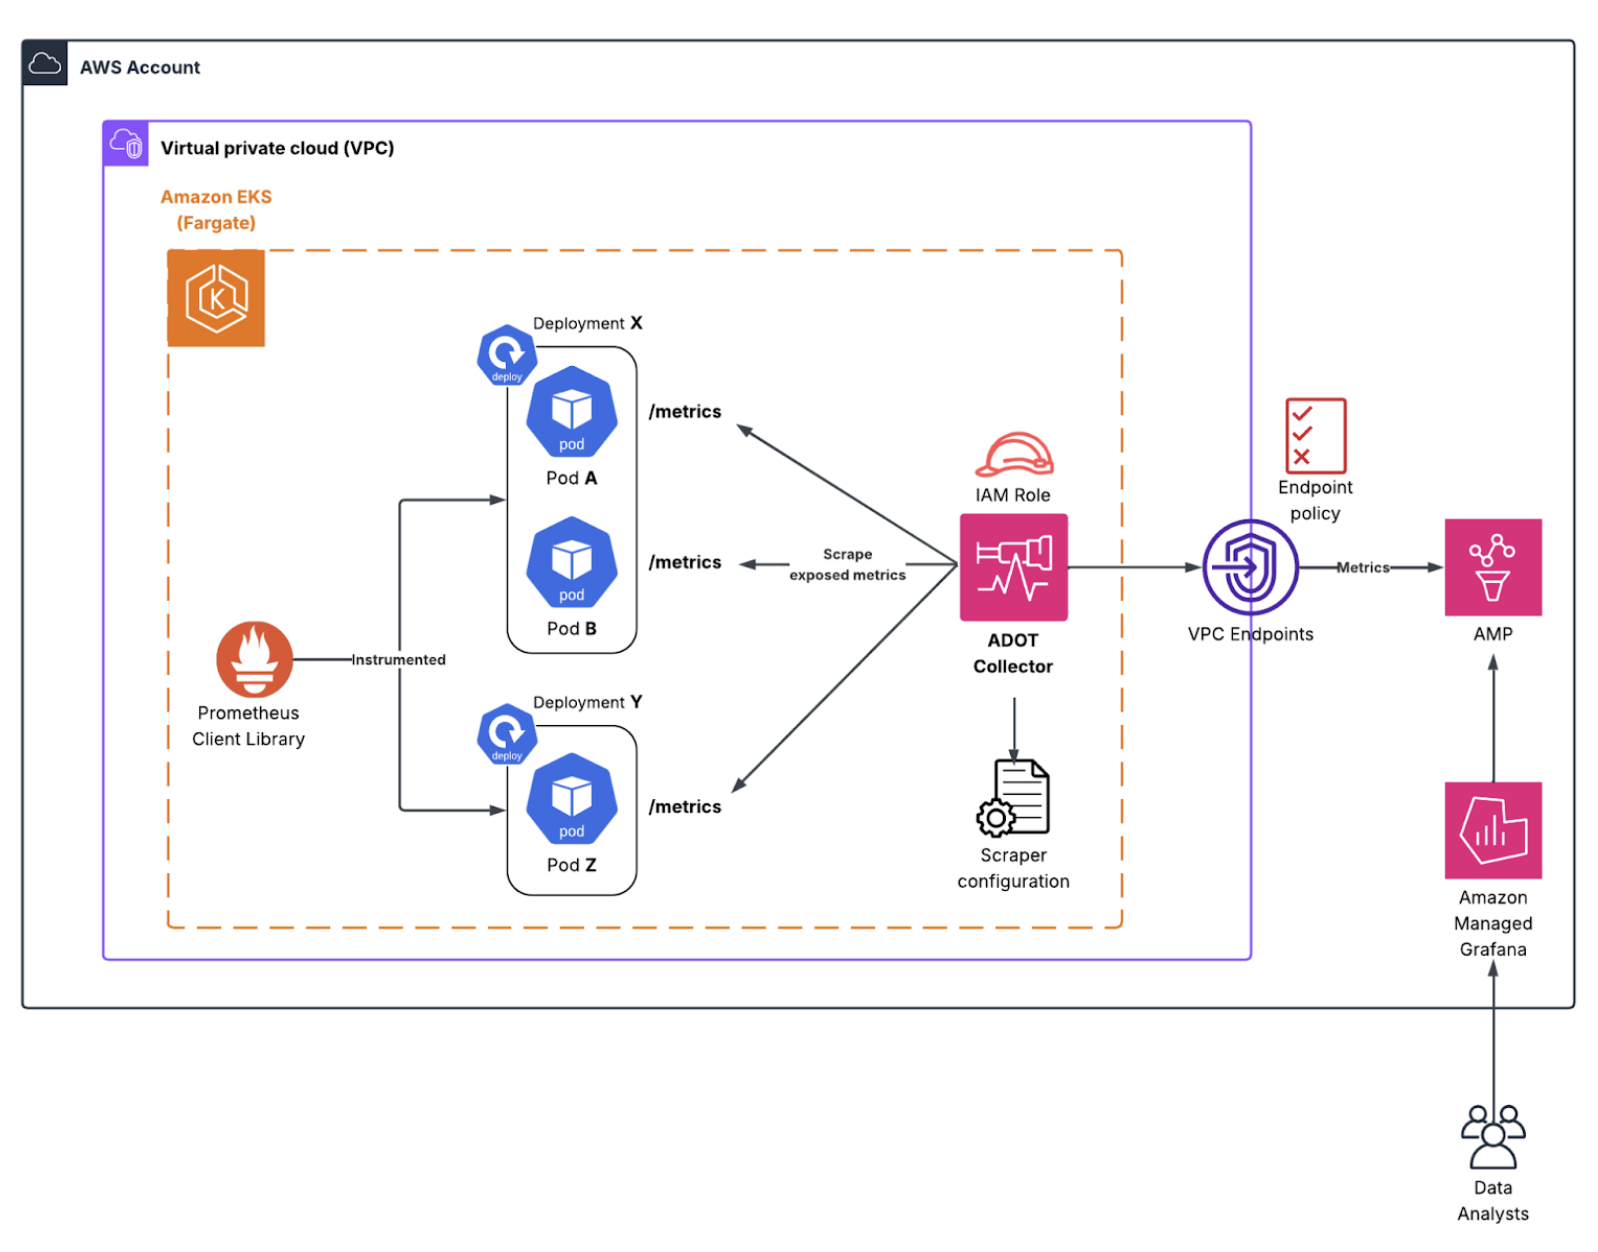
The architecture for collecting application metrics on Amazon EKS Fargate builds on the integration of managed observability services with open-source standards. At its core, the design brings together the ADOT Collector and AMP to provide a seamless pipeline for scraping, processing and storing application metrics.
- The ADOT Collector: Amazon EKS offers an ADOT Operator add-on that automates the lifecycle. The Prometheus Receiver acts as a compatible replacement for a traditional Prometheus server: discovering scrape targets and pulling metrics.
- Secure Exporting: The Prometheus Remote Write Exporter streams data to an AMP workspace. To ensure these writes are secure, the SigV4 Authentication Extension signs each request with AWS IAM credentials.
- Amazon Managed Service for Prometheus (AMP): This provides a fully managed, scalable, and highly available time-series database. It removes the need for organizations to run and scale their own Prometheus servers.
The need for customization arises whenever third-party frameworks (such as Ray Serve or Posit Connect) are integrated. In these scenarios, metric endpoints on application pods cannot be accessed directly.
Prometheus makes it possible to handle this through its extensible configuration system, where service discovery can be customized. Scrape jobs can be defined to discover specific application pods based on labels and then rewritten so that the actual requests are routed through another endpoint (the gateway/head pod) rather than directly to the underlying API pods.
Security and Multi-Account Environments
In enterprise settings, it is common to operate multiple EKS clusters across different AWS accounts. By designating one account as the observability hub, organizations can combine metrics from all environments while preserving strict separation of concerns.
Security is managed via IAM Roles for Service Accounts (IRSA). This integration allows Kubernetes service accounts to be projected into pods as OIDC-compliant tokens, which are exchanged for temporary IAM roles. This approach enforces the principle of least privilege and eliminates the risks associated with embedding long-term credentials.
Operational Considerations
While this architecture provides a scalable model, it introduces a level of complexity. Teams must be comfortable defining scrape configurations, working with service discovery, and managing the interaction between Kubernetes workloads and Prometheus pipelines. Additionally, organizations must monitor service quotas, such as active series per workspace and ingestion rates, to ensure the completeness and accuracy of measurements.
Optimize Your Observability with Several Clouds
By combining the strengths of open-source observability frameworks with AWS’s managed services, organizations can achieve deep visibility into workload performance and maintain operational excellence.
Download the Full Technical Whitepaper: For detailed configuration examples and advanced security models, get the official whitepaper.
Relevant Success Stories
.png)
.png)
Book a meeting
Ready to unlock more value from your cloud? Whether you're exploring a migration, optimizing costs, or building with AI—we're here to help. Book a free consultation with our team and let's find the right solution for your goals.